Browse by category
This blog was first published in 2021 and updated on October 25, 2022.
According to this article, "Wildly popular Saas solutions aren't going away any time soon." Why? The article claims it's due to their ease and affordability. In fact, the article attributes the high-growth rate of SaaS solutions to the global pandemic. When companies were forced to pivot to remote work, SaaS solutions were "among the easiest to adopt and roll out." And it seems, the SaaS industry is expected to keep up its growth with no signs of slowing down.
This Gartner release suggests that "software as a service (SaaS) remains the largest market segment and is forecast to reach $122.6 billion in 2021." Now, if you're in the SaaS market, your future looks bright, but that also comes with a caveat: with demand also comes more competition, especially with the emergence of new technologies and innovations.
So how can you accelerate the success of your SaaS business in order to gain a competitive advantage? It starts by leveraging the power of data in your SaaS metrics dashboards.
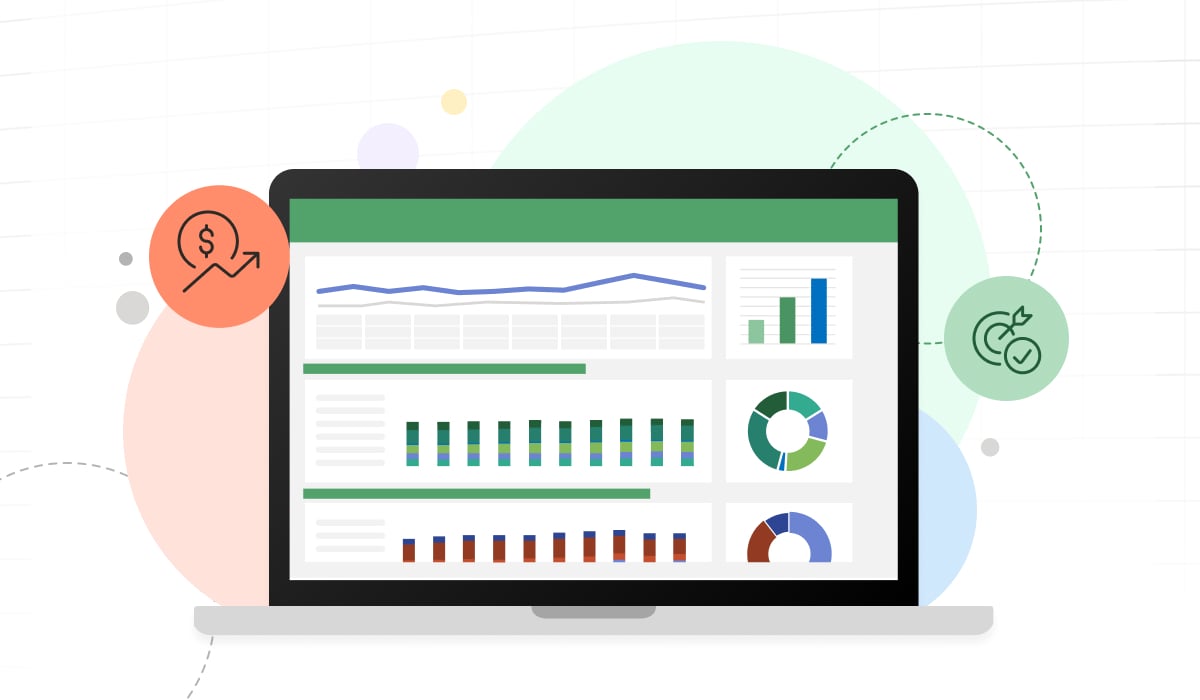
What Is a SaaS Dashboard?
SaaS dashboards offer a full view into the performance of your SaaS business. They are essentially your management and visualization reporting tools that consolidate key SaaS metrics, identify historical and real-time data trends and spot strengths as well as weaknesses in your business.
Why Do You Need SaaS Metric Dashboards?
If you're looking to improve your data management and to share key insights with key stakeholders within your organization and externally, SaaS metrics dashboards are critical to your success. Offering a cohesive view of the key functions and metrics of your SaaS business, not only do SaaS metrics dashboards in Excel help you and your teams work collaboratively to understand your data, they also help drive strategic decision making that will ultimately benefit your business now and in the long term. When everyone in your business can get the most out of your data, they'll become more confident in driving and reaching your business objectives. This will make it easier to steer the business forward, achieve profitability, gain a competitive advantage and plan for growth.
Now, which key performance indicators should be in your SaaS metrics dashboards? Read on to discover the top seven KPIs that should be featured in your dashboard templates.
1. Customer Acquisition Cost
There are many factors determining the success of your business, but when it comes right down to it, the lifeline of your business is your customers. That's why it's important to track how much your customers are worth to your business. One of the ways you can do this is by determining your customer acquisition costs (CAC), that is, what you spend to attract new customers. This calculation can be obtained by dividing the total expenses (including salaries) incurred by sales and marketing programs by the number of new customers acquired during a specific timeframe. Once you know how much you spend per new customer, you can then determine how much you can expect to earn from them, or in other words, the customer lifetime value.


The customer lifetime value (CLV) is a measurement that takes into account a customer's entire purchasing relationship with your business. This includes product purchases and ongoing services provided to customers. There are different ways to calculate the CLV, but one of the easiest ways to get an approximate CLV measurement is by dividing your net profit in a set time period by the number of customers served in that period.
Once you have your CLV, you'll also want to take into account three variables that should be tracked per customer: recency, frequency and monetary value. So for instance, a higher customer lifetime value means a longer purchasing period, a higher frequency of purchases and more money spent on purchases. With this information, you can then divide your customers in high, medium or low value segments and then determine the CLV per segment.
Your CAC and CLV metrics will help you determine whether you're spending too much money acquiring new customers that aren't providing a high CLV. Ideally, you want your CAC to be low and your CLV to be high. If this isn't the case, you can make any necessary changes to keep your business profitable and growing.

3. Average Revenue Per Unit (ARPU)
The average revenue per unit represents the average revenue per user, or unit, over a specific time. This calculation is one of the most important metrics for your SaaS business because it allows you to see your growth potential on a per customer level. This in turn helps you model your revenue generation capacities in both the short and long terms.
The ARPU metric when broken down, also helps you identify trends within a certain customer segment versus others. For instance, are there certain price points that customers are selecting over others? With this information, you'll be in a better position to upsell or down sell trends, a critical factor in determining the success of your SaaS business model and your overall financial health.
Your ARPU is your guide to understanding how well your SaaS business is actually doing. It can be used to accelerate your monthly recurring revenue (MRR) growth and to inspire your customer lifetime goals, ensuring that your business is on the right trajectory to achieving optimal success.

View all your labor expenses in one place, leverage our interactive dashboard and get a detailed breakdown of expenses by type and by month with this free best-practice Excel template.

4. Monthly Recurring Revenue (MRR)
Monthly recurring revenue (MRR), the predictable revenue amount you can expect to receive on a monthly basis, is a critical metric for SaaS businesses. Calculated by taking your monthly average revenue per user (ARPU) and multiplying it by the total numbers of users in any given month, your MRR gives you an accurate status update of how your company is doing. Once you know your MRR, you can also dig deeper into the metrics to determine monthly figures per segment (new MRR, add-on MRR, churn MRR) and calculate your MRR growth.
As a predictable and comparatively consistent figure, your MRR helps you with your financial forecasting and planning. By knowing your monthly recurring revenue figures, it becomes easier to model estimates, determine your cash flow and measure the overall profitability of your business so you can plan your business accordingly.
And knowing your MRR can also motivate your teams. For your product team, it encourages them to continue building a better product in order to retain your customers. For your sales and marketing teams, it drives them to improve MRR by focusing on net new MRR, that is, quality of leads over quantity. 
Customer churn rate is a key performance indicator that is used to track the number of customers that leave your service(s) over a specific time period. You can determine your customer churn rate percentage by dividing the total number of churned customers by your total number of customers.
Churn rates vary based on the stage and size of your company. If you're a SaaS startup, you can expect your churn rate to be higher as you establish what it is your product needs to do and to solidify its place in the market. But once you've worked this out and achieved product market fit, it'll be easier for you to reduce your churn rate fairly quickly. Small- to medium-sized SaaS businesses that typically bill monthly or have shorter contracts also tend to have a higher customer churn rate. The reason for this is that there are little or no costs associated with customers leaving after these shorter terms. Larger enterprises with a higher product cost tend to have low churn rates since customers who pay the higher price are less likely to switch due to increased costs associated with ending a contract or with switching, implementation and training.
Whether you're an early SaaS startup or an established enterprise, tracking your customer churn rate and benchmarking it against previous years can help optimize your pricing strategy, models and goals.
6. Revenue Churn
Once you know how many customers are leaving your product or service(s), you'll also want to determine your SaaS revenue churn, calculated by dividing your monthly recurring revenue by your total MRR. This KPI factors in the percentage of monthly recurring revenue your SaaS company is losing due to customer churn and also factors in the different pricing models you charge your customers. Monitoring your performance and overall financial health, your revenue churn is a clear indication of your real losses. It'll also tell you what's costing the revenue growth of your company.
7. Customer Retention
Holding on to your existing customers is much easier than acquiring new ones. That's why monitoring your customer retention metric—the number of customers your company retains over a given period of time—should be a priority for staying ahead of the churn and retention cycles.
Your current customers are your most promising users and if you can keep them as long-term users, this will provide you with more opportunities to upsell, thereby increasing their lifetime value. As long-term users of your product or service, they will understand the value you provide and will be much more likely to recommend your product and boost your business's health by bringing in new users.
Keeping a close eye on your customer retention rate will always tell you what's working well and what needs improvement. This metric will give you a clear understanding of lifetime customer value and will also help you evaluate the efficacy of your marketing and customer service strategies.
The success of your SaaS company depends on making data-driven decisions for your marketing, sales and customer success operations. And to make those data-driven decisions, you have to know which metrics to track. Tracking these top seven KPIs on your metrics dashboard will give you a clear indication of your business health. They'll also align your teams with insights, improve your competitive advantage and set the stage for growth and profitability.
To learn more about how to keep your SaaS financial planning and reporting simple with proven SaaS dashboards, templates and modeling tools—all within the Excel interface, get started with Vena for SaaS, or try the FREE Executive Dashboard Template for Excel and the FREE Marketing Dashboard Template for Excel.
As Vice President, FP&A at Vena, Tom Seegmiller is responsible for strategic finance, including business partnering, budgeting and forecasting, with a focus on optimizing enterprise value. Tom is instrumental in the formulation of the financial narrative for the executive leadership team, investors and board members. Tom has always had a focus on driving enhanced business decisions through leveraging financial and operational data. He is an experienced finance executive, having most recently led the finance team at Miovision Technologies. Prior to that, he was in senior FP&A leadership roles at OpenText. Tom enjoys golfing, skiing, exercising and traveling in his spare time, but most importantly, he loves spending time with his wife and daughter.