Browse by category
Data and Tech
Find out how to future-proof your organization by automating workflows and optimizing business processes—empowering your teams to work better, faster and smarter using cutting-edge technology.
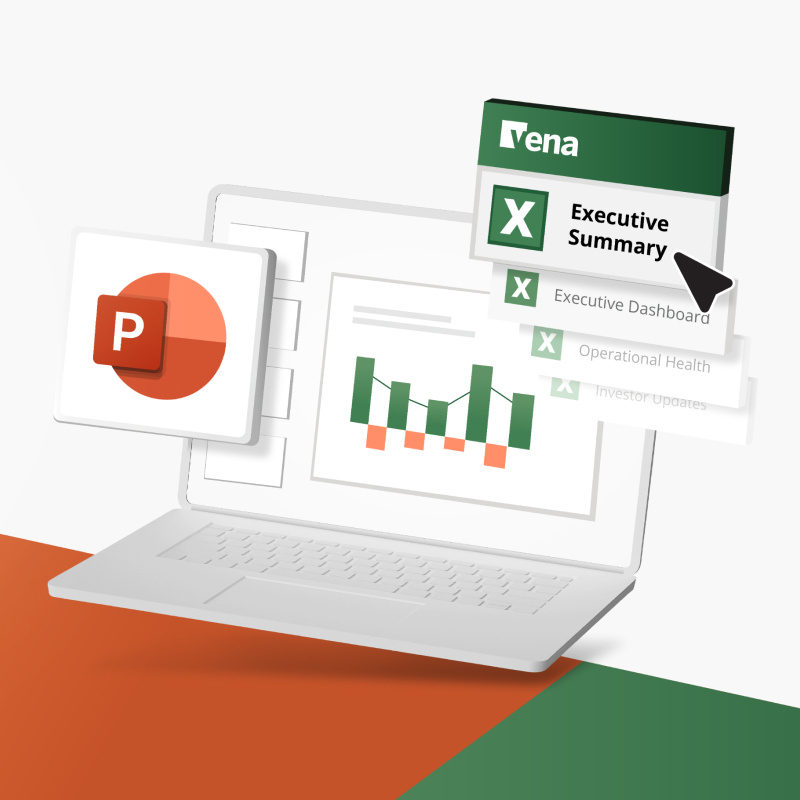
How To Build Finance Reports Faster With the Vena and PowerPoint Integration
May 16, 2024
Learn how Vena for PowerPoint allows you to build data-driven presentations in just minutes, giving ...

Vena vs. Planful: Compare Features, Integrations, Reviews & More
May 2, 2024
What’s the best CPM platform for your business—Vena or Planful? Our in-depth and objective analysis ...
How Vena Uses Vena: How SaaS Companies Use Complete Planning
May 1, 2024
Learn how Vena’s own finance team uses the Vena platform to solve challenges other SaaS companies ...

The Definitive Guide to AI in FP&A: Benefits, Use Cases and Risks Explained
April 22, 2024
Experts in finance, business and technology weigh in on the potential use cases of AI in FP&A ...
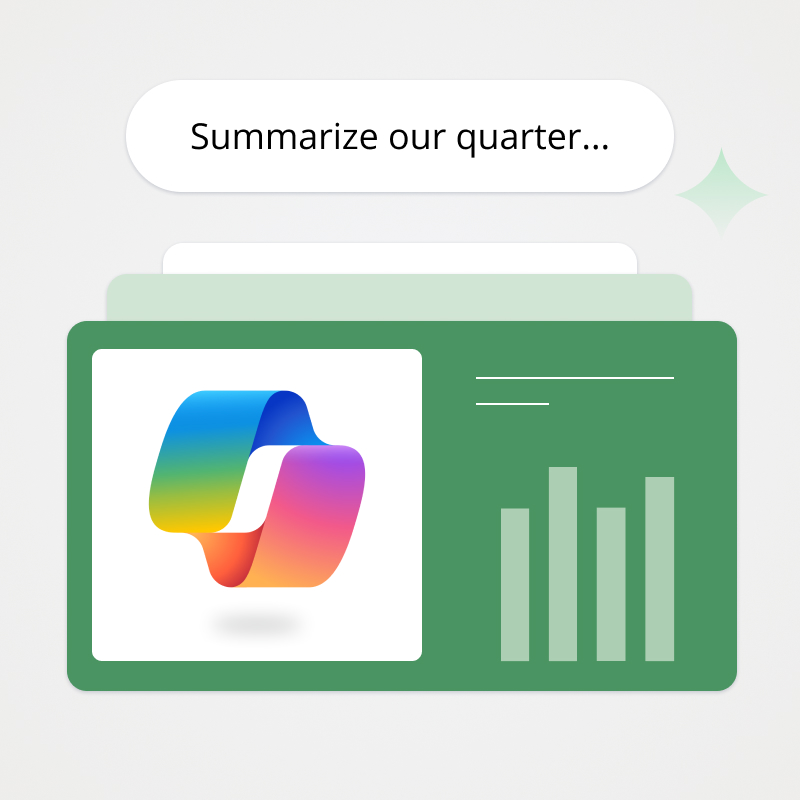
6 Microsoft Copilot Prompts for Finance Teams
April 12, 2024
Microsoft Copilot can augment finance teams’ ability to interpret data and speed up workflows. Here ...

How AI Can Power Finance Productivity—and Why Doing More With Less Matters
March 28, 2024
To keep up with business demands, today’s FP&A teams need to do more with less. Learn how ...

Should Finance Teams Use Generative AI? How To Implement AI Securely
January 26, 2024
We explore the risks finance teams need to consider around generative AI and how to use these tools ...

A Guide to Successful CPM Implementations: The Case for Starting Small
December 6, 2023
Discover when your organization should consider CPM software, what challenges to expect and why the ...

Power BI Dashboards for Finance: Key Use Cases and Examples
October 5, 2023
We cover everything finance teams need to get started with building Power BI dashboards, including ...
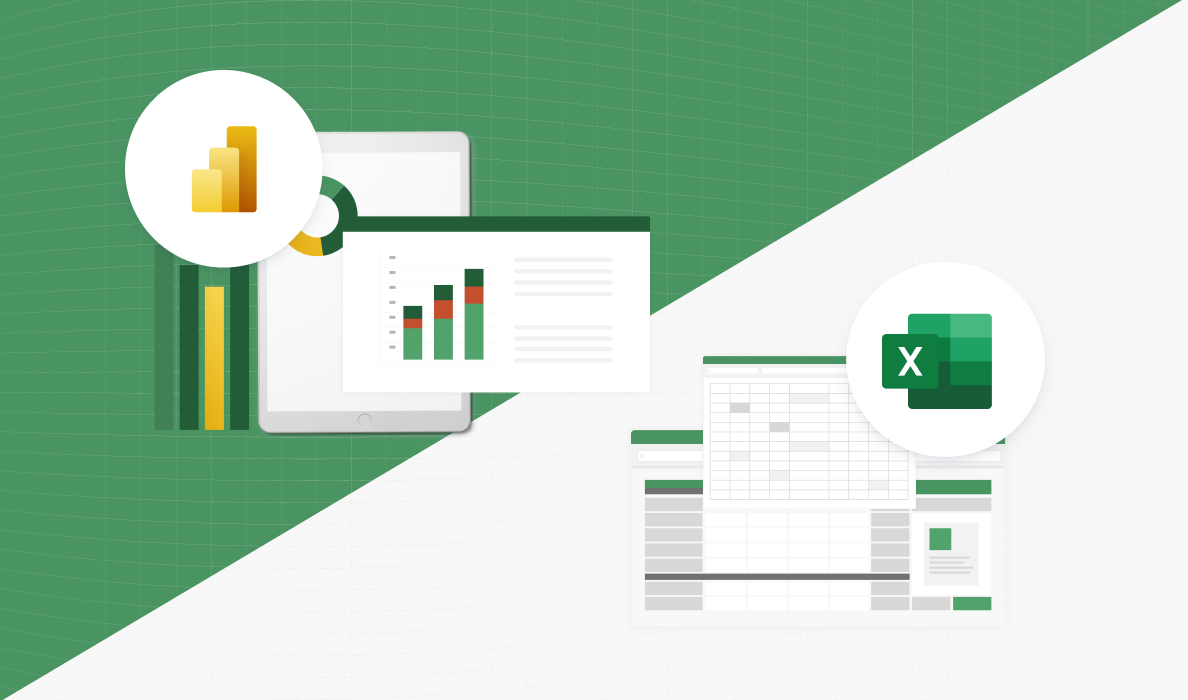
Excel vs. Power BI for FP&A
August 22, 2023
Explore key differences between Excel and Power BI, plus learn why you should be using both ...

Doing More With Less: 6 Tips for Automating Your Finance Operations
August 16, 2023
Learn what the experts have to say about optimizing and automating your finance operations—by ...

How New FP&A Technology Is Changing Finance: What CFOs Need To Know
July 27, 2023
Executives from Microsoft and Vena weigh in on how new technologies such as artificial ...