Browse by category
Are you seeking a better way to view and understand your company's financial position? While there are many options available, building a financial dashboard should be at the top of your priority list.
Once you create a dashboard, you can take advantage of benefits such as:
If these benefits pique your interest--and they probably do--keep reading to learn how to build a dashboard that will meet your every want and need.
Even if you know everything about how to make a dashboard, it does you no good if you don't have a defined list of short- and long-term goals. In other words, what are you trying to accomplish with a financial dashboard?
Common goals include:
By outlining your goals upfront, it's easier to build a financial dashboard that meets all your company's requirements. 
This is the "meat and potatoes" of your financial dashboard. You don't have a dashboard without data. Just the same, if you gather the wrong data, it won't do anything for you.
Rather than make selections on a whim, start by deciding what type of dashboard you want to build. Generally, your two options are a general financial dashboard and a financial reporting dashboard.
Ask and answer these questions when deciding which type of dashboard to develop:
For instance, a general financial dashboard is a good place to track revenue and net income. When you move into a financial reporting dashboard, your attention will turn to the data points needed to close out a month, quarter or year.
Tip: Resist the urge to display an overabundance of data. Doing so will overwhelm users, thus making it difficult to understand the numbers. Stick with a high-level view, with the ability to dig into finer detail if necessary.
A financial dashboard is built with the idea of providing real-time data. Even so, that doesn't mean you should let it consume your day.
Choose a frequency for how often you conduct a deep review of the metrics shared in your dashboard. Should you do this weekly? Monthly? Quarterly?
Your goals once again come into play. If you're creating a financial reporting dashboard, choose a frequency that aligns with your financial closing schedules.
If you're using a general financial dashboard to chart high-level metrics, such as revenue and profit, reviewing your dashboard once a week or twice a month may make more sense.
The frequency you use today may not be the frequency you use in the future. Adjust this as necessary so that you always have fresh data when you need it.
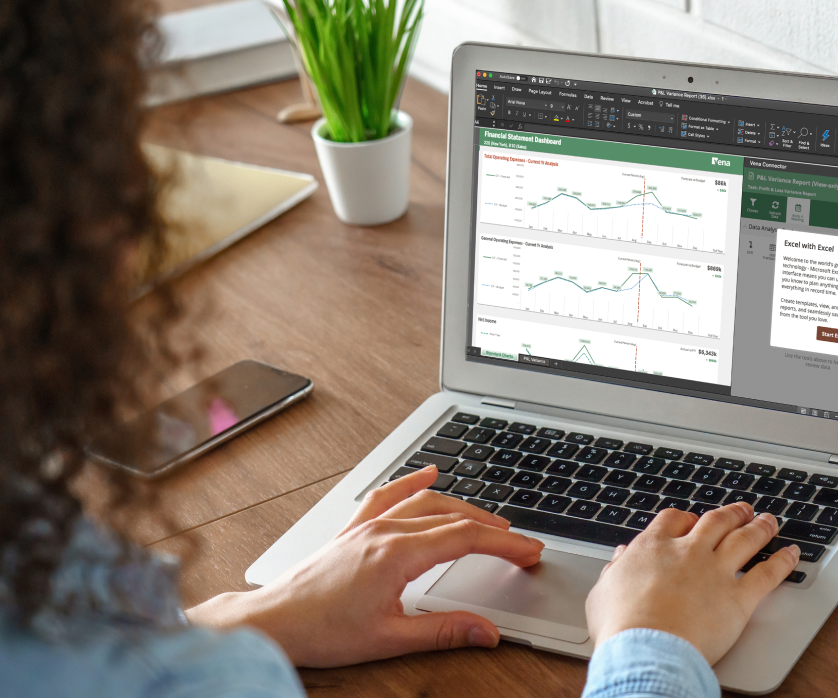
Choosing a financial dashboard design is critical to ensuring data that's presented in a simple and easy-to-digest format.
Charts and graphics are two of the most commonly used designs, as these visual aids make it easy to understand the data presented in a financial dashboard.
Think about it this way: Is it easier for you to consume data graphically or by reading a paragraph on performance?
With a chart, it only takes a few seconds to review month-over-month or year-over-year performance. When put into words, it's much more time-consuming to find answers to your questions.
The nice thing about choosing a financial dashboard design is that you can change it with a few clicks of your mouse. As long as you have the data, you can present it in a variety of ways. This allows you to take a trial-and-error approach to choose the design that suits you and your team.
Once you've taken the steps above, there's one last question to answer: who needs access to your financial dashboard?
This is a question you have to answer on your own. It varies from person to person and company to company. For example, if you're the only person responsible for the financial close process in your company, you may be able to keep your dashboard all to yourself. On the flip side, if you're part of a robust financial department, you'll likely want to share the dashboard with the rest of your team.
You don't have to share it with everyone at once. If you're still fine-tuning your dashboard, invite a handful of co-workers to review and test it out with you. From there, if everything checks out, you can share it with anyone else who needs access.
Now that you know how to develop a dashboard, you should feel confident in your ability to take action. When you're ready to take the first step, Vena is here to help. By creating interactive dashboards and reports, you'll better understand key financial metrics that are critical to the short- and long-term viability of your company.