A financial dashboard is designed to track a variety of finance-related key performance indicators (KPIs). With it, anyone and everyone with access to this data can quickly obtain an accurate overview of the performance in question.
In this guide, we answer a variety of questions related to financial dashboards and also dive into why they are critical to the success of an organisation.
Above, we shared the basic definition of a financial dashboard. Now, let's dive into the finer details to better understand if it's something your company needs.
A financial dashboard is a data visualization tool used to track KPIs across the financial spectrum. This can include, but is not limited to departments such as accounting, sales, marketing, customer service and human resources.
By sharing data with different stakeholders across your organisation in an easily digestible format, such as charts and graphs, it's simple to track the ongoing health of your company's finances, regardless of the amount of data or where it's being pulled from.
No two companies are identical, but the majority of them share similar reasons for using a financial dashboard. Here are four of the most common reasons why dashboards are important for performance:
Have you ever attempted to manually gather data month after month? How long did it take you? What could you have done with that time?
Without a financial dashboard, you have two options: manually gather data from data sources or skip this altogether. Neither option is ideal.
But with a financial dashboard, everything is done automatically on your behalf. Once your dashboard is set up to pull data from the appropriate sources, you no longer have to spend any time on this task.
Depending on how much data you have and how often you manually gather it, setting up a financial dashboard could save you many hours of tedious work over the course of a month.
Not only is the manual collection of data time consuming and cumbersome, it also increases the risk of errors. And if you do that, it could result in a chain of events that leads to lost time and money, poor decisions and personnel issues.
By removing the tedious, manual compilation of data from the process, you eliminate the risk of errors. There are no more concerns about writing down the wrong number or pulling data from the wrong date range.
It's one thing to collect data, but another thing entirely to share it with others in your organisation.
Without a financial dashboard, you may rely on traditional methods of sharing data, such as email and in-person meetings. While there is a time and place for these options, they're far from efficient.
Once you create a financial dashboard, you can share it with anyone (or everyone) in your organisation with a click of your mouse. Furthermore, you can decide which type of access to grant. For example, some people may require read-only access while others need administrative rights.
The last thing you want to do is assume that you know how your company is performing. Even if you're right, it'll cause confusion down the road.
A financial dashboard allows you to accurately track the performance of KPIs in real time. You can then compare periods, such as month over month or year over year. And best yet, you can do all this within a matter of seconds.
If your revenue numbers are here and your expense numbers are there, you don't have an efficient system in place. Data that's scattered all over the place is more likely to go missing and to have inaccuracies.
Using a financial dashboard allows you to keep all your data in one place, allowing you to quickly review and share with others. There's no more jumping around from one resource to the next.
There's no shortage of the types of financial dashboards you can create. If you need it and if you can dream it up, you can create it.
Here are five financial dashboard examples, including guidance on what they can do for you:
A business health dashboard helps you consistently measure the overall financial health and well-being of your organisation.
It's used to measure both short- and long-term financial metrics with a focus on data points such as revenue and net-new revenue, net profit margin and LTV:CAC.
A business health dashboard may not answer all your finance-related questions, but it'll always keep you informed of your company's general financial health.
This is all about the relationship you have with your customers. It's particularly important if you have a subscription-based business in which turnover rate is critical to financial health.
Also, with a customer health dashboard, finance leaders can better communicate with sales, marketing and customer success teams to resolve challenges and implement new and improved strategies.
A customer health financial dashboard can include data such as the number of active customers, gross and net revenue retention and time to value.
Remember, you don't have a business if you don't have customers. That's what makes this dashboard one of the most important.
Without employees, you'd have a difficult--if not impossible--time satisfying your customers. And when customer satisfaction dips, so does revenue.
An employee health dashboard tracks metrics that are important to the financial health of your company as well as to its overall performance. It can focus on metrics such as revenue per employee, employee retention, new hire training costs and headcount budget versus actuals.
Just because you're generating revenue doesn't make your company profitable. In addition to a standard profit and loss statement, a profit and loss dashboard will keep you current on the profitability of the company.
The goal of a profit and loss dashboard is to track metrics including but not limited to revenue, gross profit, OPEX ratio, operating profit margin and net profit margin.
A CFO (chief financial officer) doesn't need (or want) to know what's happening at every level. Instead, they're most interested in an accurate, current, high-level overview of the company's financial health.
A CFO dashboard gives them that, with key metrics such as revenue, gross profit, EBIT, EBIT %, net income and operating expenses.
The steps that you take to build a KPI dashboard are unique to your company, its financial circumstances and its many financial needs.
On the plus side, there's no shortage of options available to you. Conversely, you have to narrow your options to make an informed and confident decision.
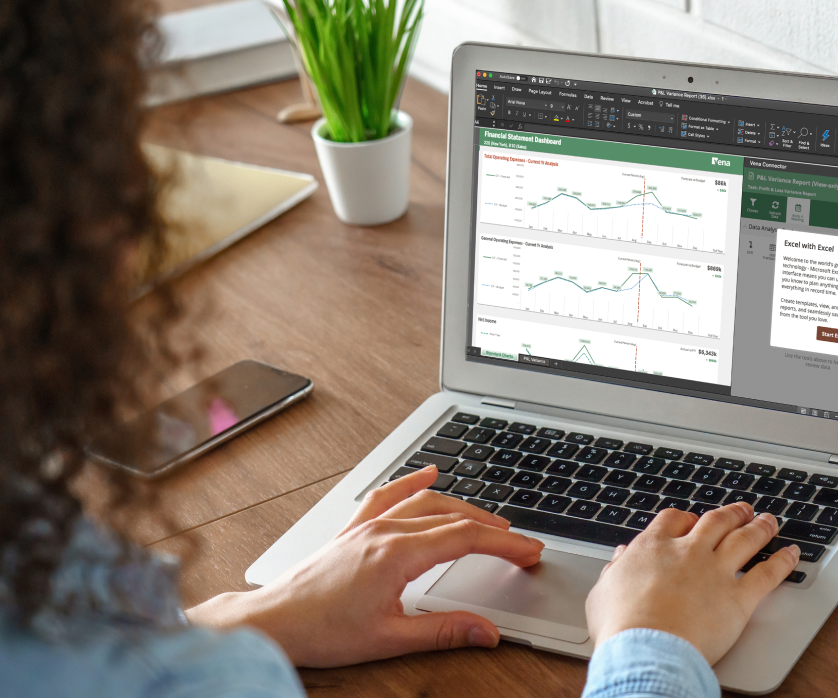
A growing number of companies are opting to create a financial dashboard in Excel, as it allows them to work toward their goals while using a familiar application.
In many ways, building a financial dashboard in Excel is the same as with any other tool. There are basic steps you must take to lay the foundation:
This can be the most time-consuming step because you're chasing down data from various services. At the same time, you're learning how to implement all of this data with your Excel dashboard.
You can make this task easier by enlisting the help of your co-workers. For instance, if you need to connect sales-related data sources, work closely with the sales department to do so.
How do you want your data to be displayed? Do you have everything you need to design a dashboard that suits the needs of you and your team?
There's no shortage of options, so experiment with several to see what piques your interest. And once again, consult with others to get their feedback.
When getting started, it's often easiest to choose a simple layout, such as a four-quadrant dashboard.
Once your dashboard is actively pulling data, it's time to verify the information. Answer questions such as:
Adding to the above, Excel alone is not generally powerful enough for most organisations. This is where Vena comes into play.
Rather than abandon Excel in exchange for another platform, Vena gives you the flexibility and tools you need to build a powerful and scalable dashboard--empowering you to store, edit, share and analyse the data that drives your business your way.
In today's business world, data-driven and strategic decision making is easier than ever with the help of financial dashboards. And with more informed decisions, you get better results.
Here are some of the ways that the use of financial dashboards can improve strategic decision making:
Even if you're experienced in the world of financial dashboards, you're likely to have questions now and again.
Here are some of the most frequently asked questions:
The answer to this question depends largely on your goals. For example, you may be interested in a dashboard to enhance your financial reporting process. Or perhaps you need to create a dashboard for your CFO that provides an overview of the company's finances.
Many finance professionals prefer to use Excel since they're already familiar with the popular spreadsheet tool. This familiarity, along with the power of the Vena Growth Engine, allows you to seamlessly build a dashboard that meets your needs.
There's no shortage of tools and integrations to consider. Power BI is one such tool to consider, as its intuitive analytics will have you seeing your data in a new way.
The answer varies from company to company. Maybe you're the only one who needs access to a dashboard. Or perhaps multiple departments could benefit from the data. The decision is yours and you can always add more people at a later date.
Yes, yes and yes again! It's imperative to include all applicable data, but that doesn't mean you should go overboard. With too much, your dashboard becomes difficult to view and understand.
It's best to create multiple dashboards as opposed to attempting to cram everything into one.
Business intelligence and financial dashboards have come a long way over the years. Today, it's simple to build a high-powered dashboard that saves time and money and assists with strategic decision making.